一个简单的交易系统
In this article we present a simple trading system that we developed based on the concepts outlined in The 10 Power Principles of Successful Trading Systems.
本文介绍一个简单的交易系统基于成功交易系统的10个准则。
Step 1: Selecting a market and timeframe
One of the most popular markets these days is the e-mini S&P, and that’s not without a reason: It's a 500 company index. One of the largest in the world and that means you have excellent and consistent liquidity, superb volatility, tremendous leverage and no uptick rule. It's a truly bi-directional market that shorts just as easily and safely as going long. It’s a fully electronic market, offering all the advantages of electronic contracts.
We decide to trade the market intraday, i.e. we will enter and exit a trade on the same day, because we do not want to expose our position to the risk of holding it overnight.
Step 2: Define entry rules
In my opinion swing trading is actually one of the best trading styles for the beginning trader to get his or her feet wet. That’s why we decided to use a swing trading approach in this example.
Many traders are familiar with the concept of “Bollinger Bands”: Bollinger Bands consist of a centerline and two price channels, one above the centerline and one below. The important thing to know about Bollinger Bands is that they contain up to 95% of the closing prices, depending on the settings.
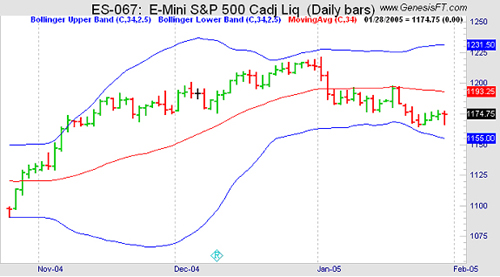
In the chart above you see the red centerline and the blue price channels. There are only 2 days in the beginning of November when prices close outside the Bollinger Bands.
We are using this knowledge to create a very simple entry rule:
- Sell when prices move above the Bollinger Bands and
- Buy when prices move below the Bollinger Bands.
The idea is that prices will move back into the Bollinger Bands by the end of the day.
Step 3: Define exit rules
Let’s start with a very simple exit rule:
- Exit the trade at the close of the same day.
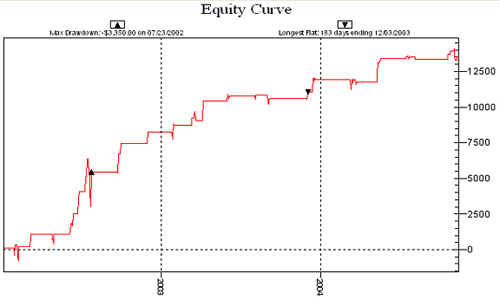
Below is the equity curve of the last 2 years. The first results are encouraging.
Step 4: Evaluate your system
The Net Profit of this simple trading system is $13,525.
The Average Profit per trade is $149. Even if we deduct $20 for commissions and slippage we still have a net profit of $129 per trade.
The Profit Factor is 2.20.
The Winning Percentage is 66% and the Maximum Drawdown at the end of the day is only $2,775, though we have to suffer an Intraday Drawdown of $5,250.
The next step is to test the robustness of the system. Therefore we will vary the parameters we are using for the Bollinger Bands to make sure that we haven’t curve-fitted the system. If the system produces similar results when we vary the original parameters by 15%, we have a quite robust trading system.
Originally we tested the system with a setting of 34 for the Moving Average and 2.5 for the Standard Deviation. The table below shows the results of the system when using a Moving Average between 29 and 39:
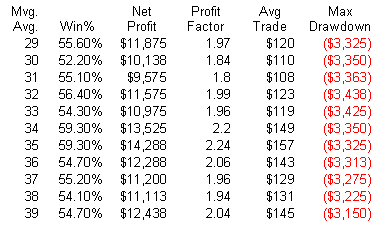
As you can see, none of these figures change dramatically when varying the parameters.
In the next step we run the system on different markets to make sure that we haven’t optimized the system for a single market.
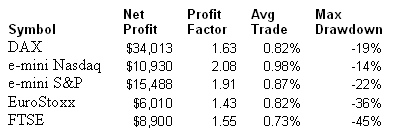
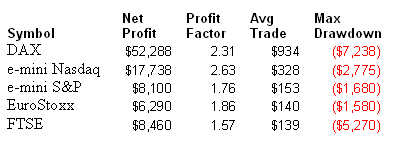
We test the system on 5 different markets:
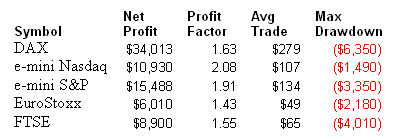
The net profit, average trade and max drawdown are substantially different, but the Profit Factor seems to be quite stable. The reason for this distorted picture is the different value of these five markets. In the next table we look at the Average Profit and the Max Drawdown as a percentage of the net profit:
Now we see a different picture: Only the Max Drawdown differs quite a bit depending on the market, but the remaining figures are rather stable.
It seems that we developed a robust trading system that will perform well in real market conditions and on several markets.
Step 5: Improving your system
We try to improve our system by adding a stop loss:
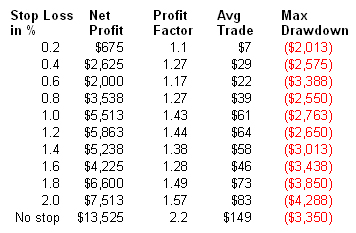
Notice that the system performs best without any stops.
Another interesting test is to increase the duration of the trade: The original rules said that we exit the trade at the end of the day. The following table shows the results when we add x days:
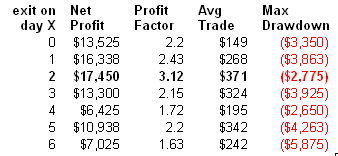
If we exit on at the end of the 2nd day after entering the market, we increase the net profit and decrease the Max Drawdown. That’s the kind of improvement we are looking for.
As a last step we test these settings on the five markets again to ensure that we haven’t curve-fit the parameters to only one market:
Original settings (exit on the same day):
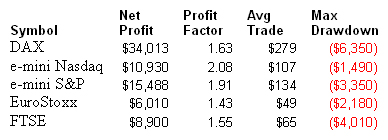
Modified settings (exit on the close of the 2nd day after entering):
We can see a dramatic improvement in the other markets, too.
Conclusion 结论
We started with a very simple idea and defined two easy entry rules. Applying the simplest of all stops (exiting at the end of the day) we received a system with a nice performance. We tested the system with several parameters and on several markets to make sure that we haven’t curve-fitted the system to a certain parameter set or market. Then we tried to improve the system: While applying a stop loss did not increase the system’s performance, the increase of the time in the trade was very successful: We increase the net profit by 30% while decreasing the max drawdown by 17%. Applying these new rules to the other markets we noticed a dramatic increase of all figures in all markets.